
Managing multiple SaaS instances means juggling different dashboards, logins, and alerting rules. Without a central view, you miss slowdowns until users complain. This guide walks you through six steps to get full visibility across all your instances, from picking the right dashboard to automating insights with AI.
Step 1: Centralize Monitoring with a Unified Dashboard
The first step is to stop context-switching between instance dashboards. You need one place that shows health, latency, and error rates across every SaaS instance you manage. A unified dashboard gives you real-time awareness without logging into each tool separately.
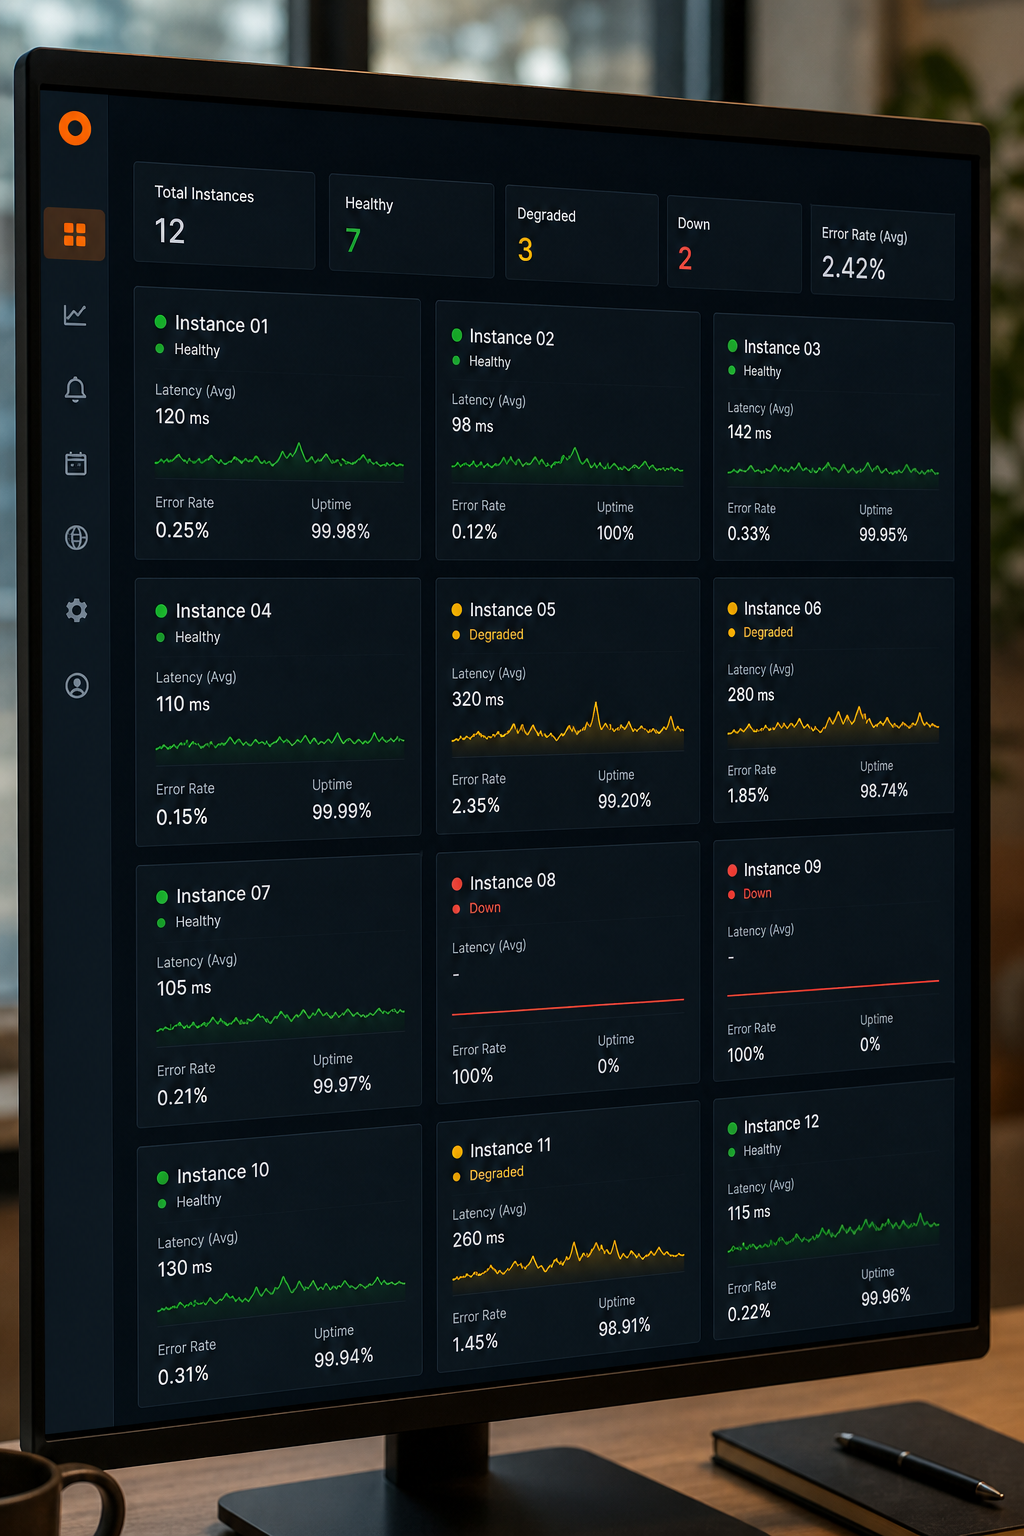
Start by choosing a monitoring platform that supports multi-instance aggregation. Many platforms offer API integrations that pull metrics from each instance into a single pane. Configure it to show at least uptime, response time, and error rate for every instance. For example, you can use a tool like Datadog or ControlUp, which extend visibility to the last mile, browser, network, and endpoint. on SaaS monitoring, the real challenge isn’t just whether an app is up, but whether it actually works well for the employee. A unified dashboard must capture that user experience, metrics like page load time and connection drops.
When you set up the dashboard, group instances by environment or client. Label each instance clearly so you can filter and sort. For agencies managing client instances, a dashboard that separates tenant data with RBAC is critical, you don’t want to ing another’s. Donely‘s own platform includes per-instance RBAC and audit logs, as outlined in our guide on enterprise audit log compliance for SaaS platforms, making it easy to grant read-only access to clients while keeping control.
Step 2: Define and Track Key Performance Indicators (KPIs)
Once you have a dashboard, you need to know what to measure. Standard KPIs for SaaS performance include latency (e.g., 95th percentile response time), error rate, throughput, and saturation (resource usage). But for multi-instance monitoring, you also need tenant-specific metrics like per-instance active users, API call volume, and storage consumption.
Start with theFour Golden Signalsfrom Google’s SRE book: latency, traffic, errors, and saturation. Map these to each instance. For example, latency might be the time to load the home page; traffic might be API requests per minute; errors could be HTTP 500s; saturation could be CPU or database connections. Then add business KPIs like conversion rate or session duration.
Define these for every instance consistently. Use the same metric names and measurement units across instances so you can compare apples to apples. A good practice is to create a metric dictionary, a shared document that defines each KPI, its source, and its target value. This makes it easier for your team to discuss performance without confusion.
When you track KPIs, set thresholds for warning and critical alerts. For example, warn when latency exceeds 2 seconds, alert at 5 seconds. Review these thresholds quarterly as usage patterns shift.
Step 3: Set Up Automated Alerts and Anomaly Detection
Manual monitoring doesn’t scale. You need automated alerts that notify you when a KPI crosses a threshold or when unusual behavior occurs across instances. Anomaly detection uses machine learning to spot patterns that deviate from baseline, catching issues before they affect users.
Configure alerts per instance but with a global override. For example, you might want to know if any instance goes down, but also track specific thresholds per client. Set up escalation rules: first alert goes to the instance owner, then to a team channel after 10 minutes of no response.
When setting up anomaly detection, consider using a tool that learns normal patterns. It should catch gradual degradation, like memory usage creeping up over days, which static thresholds miss. According to Dotcom-Monitor’s best practices for SaaS monitoring, automated synthetic checks paired with real-user monitoring give the most complete picture. Synthetic probes run on a schedule to simulate user actions, while real-user monitoring captures actual traffic.
Don’t forget alert fatigue. Tune alerts so only actionable ones page your team. Use grouping to suppress duplicates when the same issue affects multiple instances. Platforms like Donely include built-in anomaly detection and centralized alerting per instance, reducing noise.
Step 4: Implement Cross-Instance Reporting and Analytics
Dashboards give you real-time data, but you also need historical reports to spot trends and plan capacity. Cross-instance reporting aggregates data from all instances to show overall health and usage patterns. This helps you answer questions like: Which instance consumes the most resources? Which had the most incidents this month? How does performance compare across environments?
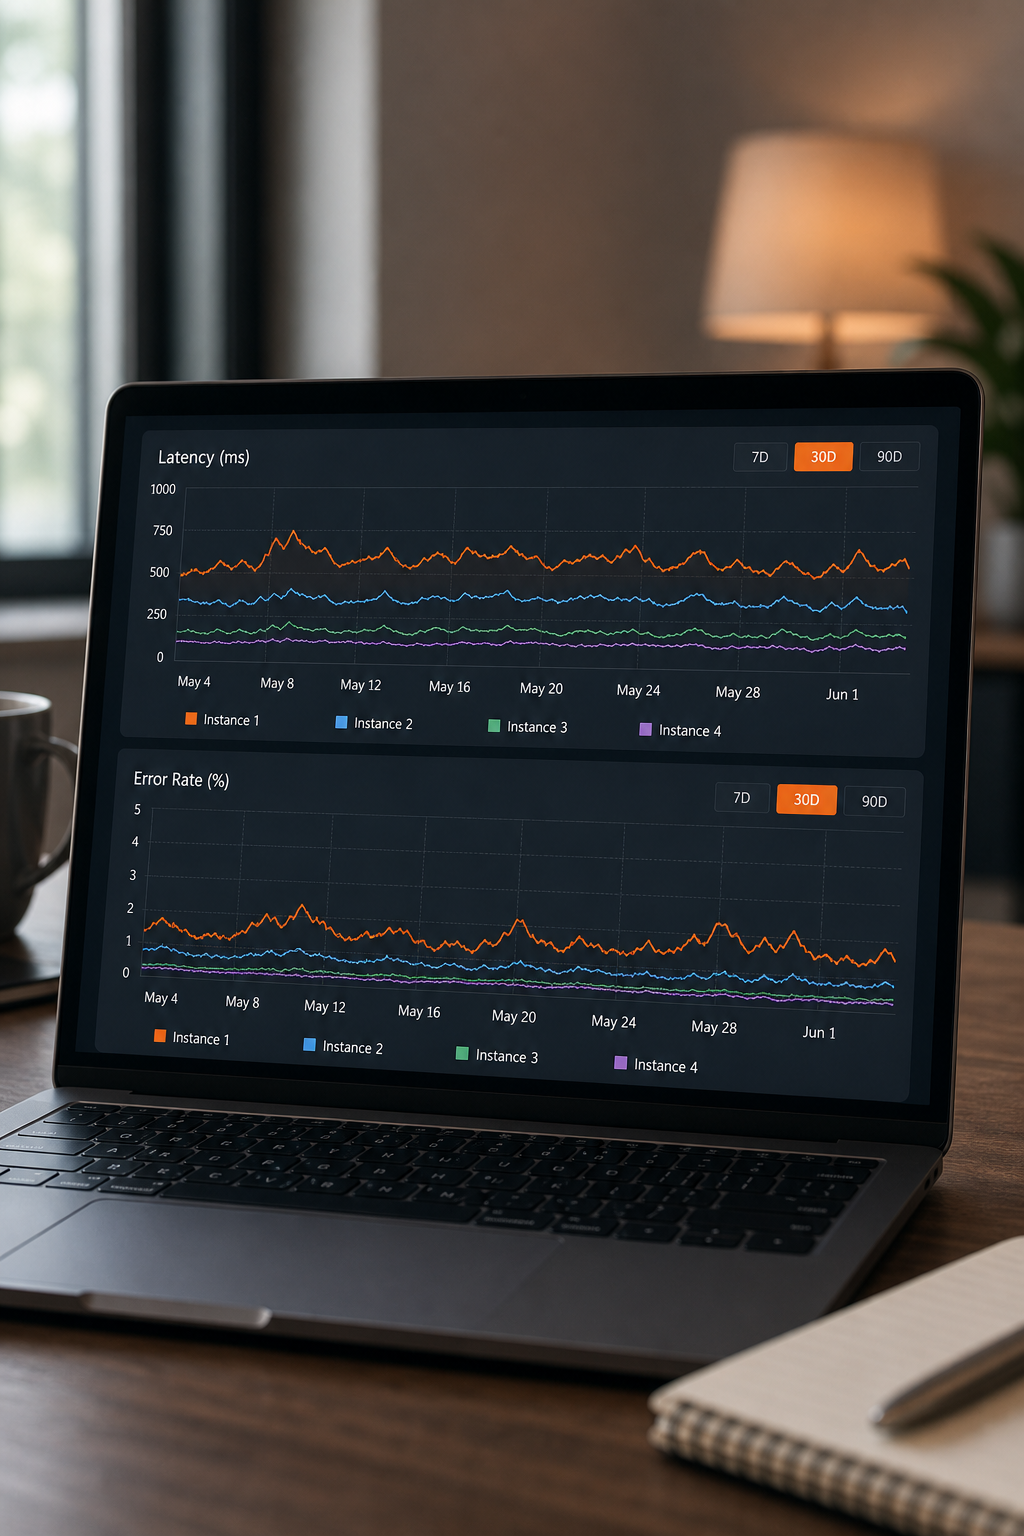
Use reporting tools that pull metrics from every instance into a single data store. Most monitoring platforms offer an API to export logs and metrics. Schedule daily summaries that show top issues and trends. For deeper analysis, export to a data warehouse and use SQL or BI tools to build custom reports.
Cross-instance reporting also helps with compliance. If you need to provide performance SLAs to clients, you can generate per-instance reports with uptime, latency percentiles, and incident counts. Donely automatically generates audit logs and performance reports per instance, as detailed in our article on multi-tenant SaaS platforms for client instances, which you can share with clients as proof of reliability.
One common pitfall: data aggregation can obscure per-instance problems. Always include drill-down from aggregate views to individual instance details. Your report should let you see the forest (all instances) and the trees (each instance).
Step 5: Use AI and Automation for Predictive Insights
AI goes beyond anomaly detection. Predictive analytics can forecast resource needs, identify upcoming bottlenecks, and even suggest remediation steps. For multi-instance environments, AI models can learn from all instances to detect patterns that a single-instance view might miss.
Look for platforms that offer predictive capacity planning. They analyze historical metrics to predict when an instance will run out of disk space, memory, or API quota. You can then proactively scale or alert the client before performance degrades. Some tools even auto-remediate by restarting services or spinning up additional resources.
Automation is key. When an alert fires, an AI agent can run diagnostic scripts, collect logs, and even roll back a recent deploy. This reduces mean time to resolution (MTTR) dramatically. For instance, Donely’s OpenClaw agents can perform automated health checks and remediation across instances, following runbooks you define. This turns monitoring into a self-healing system.
Another use case: AI can correlate events across instances. If multiple instances spike in latency at the same time, the root cause might be a shared API or network provider. AI can surface that correlation and suggest a global issue rather than per-instance troubleshooting.
Step 6: Continuously Optimize Based on Performance Data
Monitoring is not a set-it-and-forget-it activity. You must regularly review performance data, adjust thresholds, and refine your monitoring setup. Schedule a monthly review of incident reports and metrics. Ask: Which alerts were false positives? Which KPIs need new thresholds? Are there instances that consistently underperform?
Use the data to prioritize optimization efforts. For example, if one instance has high latency due to a slow database, invest in query optimization or caching. If another has low usage, consider right-sizing resources to save costs. According to Loggly’s five tips for monitoring SaaS, treat scalability and reliability as product features, monitoring gives you the data to treat them that way.
Also, review your monitoring setup itself. Are there new metrics you should track? Are there instances you added but haven’t connected to the dashboard? Keep your metric definitions and alert rules in version control so you can track changes and roll back if needed.
Finally, automate optimization where possible. Use AI to suggest configuration changes based on historical data. For instance, auto-scaling rules can be tuned based on actual usage patterns rather than guesses. Donely’s platform includes continuous optimization features that adjust agent schedules and resource allocation automatically, reducing manual overhead.
FAQ
How do I monitor performance across multiple SaaS instances if I use different tools for each?
Use a unified monitoring platform that supports API integrations to pull metrics from each tool into one dashboard. Many platforms offer pre-built connectors for popular SaaS apps. You can also route all logs to a centralized log management system and then build a dashboard that aggregates them.
What are the most important metrics to monitor for SaaS instances?
Start with the Four Golden Signals: latency, traffic, errors, and saturation. Add business-specific metrics like active users, conversion rates, and API call volume. Per-instance metrics should include uptime, response time percentiles, and resource usage to compare performance across instances.
How do I avoid alert fatigue when monitoring many SaaS instances?
Group related alerts, use intelligent alert suppression, and set de-duplication rules. Tune thresholds so only actionable alerts page someone. Use severity levels: warning for informational, critical for real incidents. Automate remediation for common issues to reduce the number of alerts that require human intervention.
How often should I review my SaaS instance monitoring setup?
Review thresholds and alert rules quarterly, or after any major incident. Update your monitoring configuration whenever you add new instances or change service levels. Conduct an annual audit of your entire monitoring stack to ensure it still meets your needs.
Can I use AI to automatically fix performance issues in SaaS instances?
Yes. Advanced monitoring platforms include AI agents that can run diagnostic scripts, restart services, or adjust resource allocation without human input. This reduces MTTR. Tools like Donely’s OpenClaw agents can perform automated remediation based on pre-defined runbooks, handling routine issues 24/7.
Conclusion
Monitoring multiple SaaS instances doesn’t have to be chaotic. Start with a unified dashboard, define clear KPIs, automate alerts, and use AI to predict and fix issues before they escalate. The best approach combines real-time visibility with cross-instance reporting and continuous optimization. To see how a single platform can handle all six steps, explore Donely’s unified dashboard with per-instance RBAC, automated health checks, and AI-powered remediation. Your first instance is free to set up.